

Introduction
Study Area and Forest Fire Inventory
Factors Influencing the Occurrence of Forest Fires
Methodology
Assessment of Forest Fire Susceptibility
Discussion
Conclusion
Introduction
Forest fires represent a significant ecological, social, and economic challenge and often result in extensive environmental destruction and degradation of forest and wild habitats. Forest fires are increasing in number and extent worldwide as a result of increases in environmental temperature, population growth, and levels of human activity in forest areas. Although forest fires play a crucial role in vegetation succession and landscape transformation within natural systems (Wang et al., 2017), they pose serious risks to the forests themselves and to communities that live nearby (Liu et al., 2018). Forest fires are characterized by their spatial and temporal variability and have become a common presence in forested regions worldwide. The frequency and intensity of these fires are influenced by factors such as weather conditions, terrain, geomorphology, and the composition and structure of forest vegetation. Beyond the immediate dangers to life and property, forest fires also threaten ecosystem health. The impacts of forest fires are far-reaching and include biodiversity loss, reduced ecosystem services and productivity, increased air pollution, more frequent landslides, diminished soil fertility, and compromised water quality and quantity (Venkatesh et al., 2020). The majority of these forest fires stem from human carelessness, including the burning of waste, stubble burning, and improperly discarded cigarettes, and are typically classified as accidental. In South Korea, human actions are the primary catalysts for most forest fires. However, the roles of climatic, meteorological, and environmental factors are also significant, as they aid in the ignition, burning, and expansion of these unintended blazes. Kim et al. (2019) reports that around 57% of forest fires from 1974 to 2017 occurred in the months of March through May, with human negligence being the leading cause at an average rate of 37%, followed by stubble burning (17%), waste incineration (14%), and discarded cigarettes (5%). As a result, Korea typically designates precautionary periods during spring and fall, times characterized by relatively low humidity and higher temperatures, to improve measures for preventing forest fires.
Mapping the intensity of forest fires using traditional field-based methods is challenging, especially in regions with complex topography. Remote sensing offers a viable alternative and can be used to assess the various impacts of forest fires, particularly the significant changes in vegetation and soil moisture content, which are readily detectable by contemporary satellite sensors. Effective forest fire management is crucial for the sustainable utilization of forest resources, safeguarding the global ecological balance, and protecting property and human lives (Zhang et al., 2019). The scientific demarcation of areas susceptible to forest fires is a critical step for forest planning and management. Such mapping will contribute substantially to the development of early-warning systems (Eastaugh and Hasenauer, 2014). Accurate identification of forest fire susceptibility zones is pivotal for enhancing early-warning systems, management programs, and disaster mitigation strategies. Satellite imagery plays a key role in the spatial and temporal analysis of forest fires and is expected to continue to do so in the future.
Various satellite data, including those from Landsat, Sentinel-2, the Moderate-resolution Imaging Spectroradiometer (MODIS), and the Advanced Very High-Resolution Radiometer (AVHRR), have been extensively utilized for the mapping and assessment of forest fires (Philipp and Levick, 2020). Forest fires particularly affect vegetation reflectance, particularly in the near-infrared (NIR) and shortwave infrared (SWIR) bands. Burned areas are identifiable through distinct spectral responses, allowing burned zones to be differentiated from healthy, unaffected vegetation (Pulvirenti et al., 2020).
The application of advanced computational intelligence, including artificial intelligence (AI) and various machine learning (ML) algorithms, has proven effective for accurately delineating forest fire zones and assessing associated susceptibility of burned zones to post-fire processes. A variety of ML methods, including support vector machine (SVM), decision tree (DT), random forest (RF), deep learning neural network (DLNN), artificial neural network (ANN), multivariate adaptive regression splines (MARS), binary logistic regression (BLR), and adaptive neuro-fuzzy inference system (ANFIS), have been extensively utilized to accurately predict forest fire susceptibility zones. Previous studies have incorporated socioeconomic and natural factors in conjunction with ML algorithms, including generalized linear mixed models (GLMM) and generalized linear models (GLM), to predict the spatial characteristics and extent of forest fires (Plucinski, 2014). However, these ML models operate on different mathematical principles, leading to variations in their predictive performance of forest fire susceptibility across diverse natural and social environments (Jaafari et al., 2019).
In this study, we incorporate forest and soil map data as important indicators of wildfire susceptibility into three models of forest fire susceptibility (RF, LR, and SVM), thereby increasing the precision of the models in distinguishing areas that are highly vulnerable to wildfires. The primary aim of this research is to identify forest fire susceptibility zones within Gangwon Province using advanced ML techniques and digital mapping data.
Study Area and Forest Fire Inventory
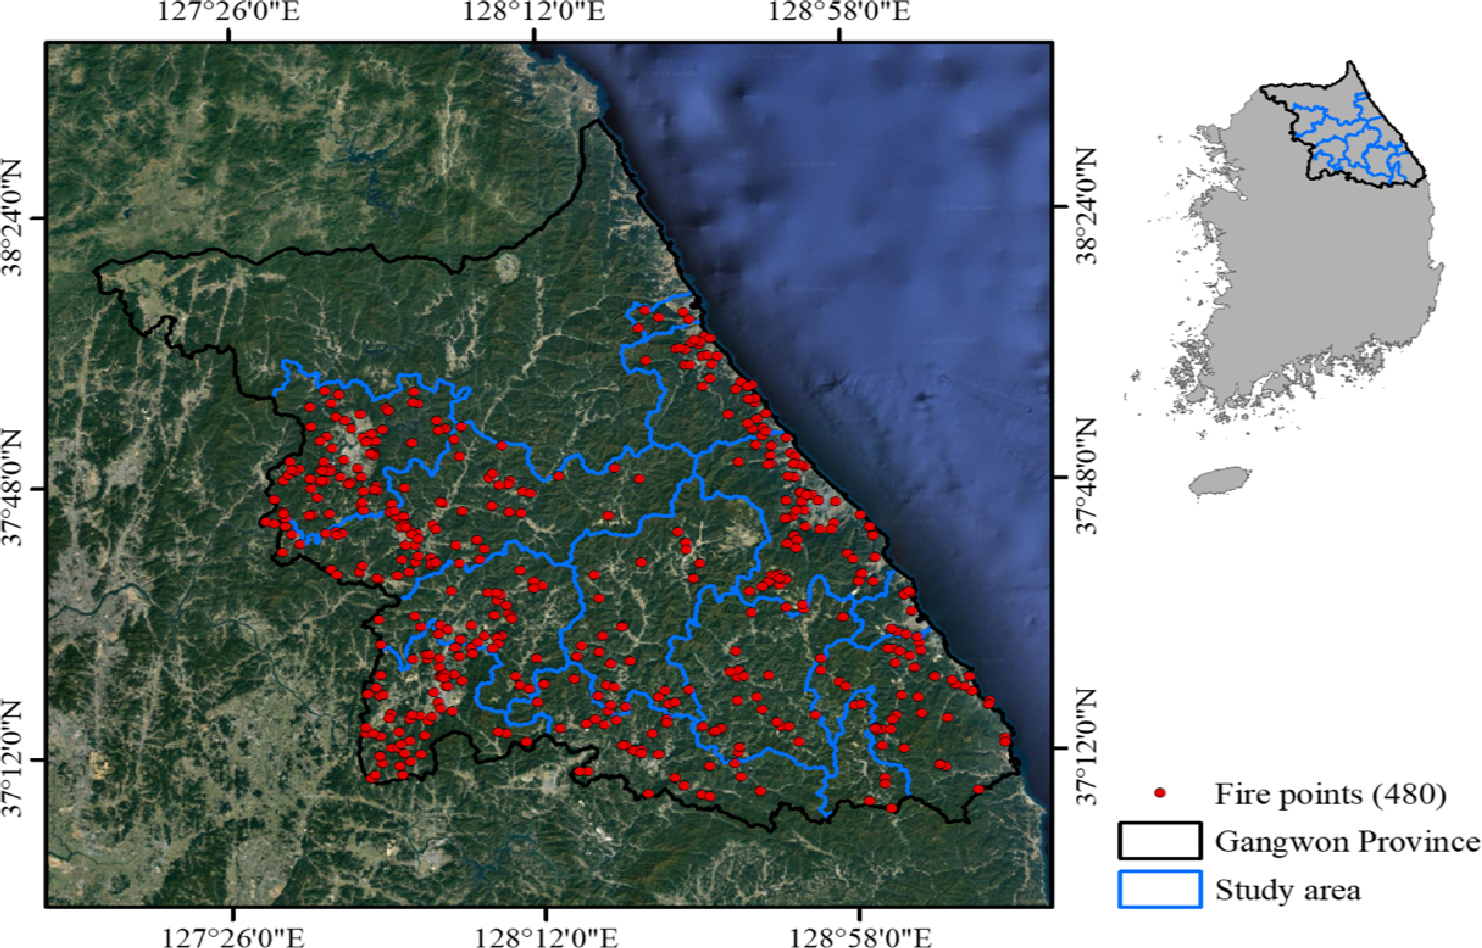
This research was conducted in Gangwon-do in northeastern South Korea. Gangwon-do is bordered by the East Sea to the east, Gyeonggi-do to the west, and Chungcheongbuk-do and Gyeongsangbuk-do to the south. Gangwon-do has the most extensive forest coverage in South Korea (Fig. 1), representing ~21% of the nation’s forested area. Forests constitute ~81% of the area of Gangwon-do, meaning this region is particularly susceptible to forest fires. Seven out of the ten most devastating forest fires in South Korea have occurred in this region, resulting in significant damage to properties and infrastructure, and to the forests themselves, and large economic losses (Piao et al., 2022). Investigation and delineation of the spatial distributions of natural disasters, such as forest fires, are critical for analyzing the relationship between disaster occurrence and the underlying causes (Pourghasemi et al., 2019). Precise location data are essential for assessing and predicting the risk of and vulnerability to such events (Moayedi et al., 2020). In this study, data on forest fires in Gangwon-do between 2003 and 2019 were sourced from the Korea Forest Service (https://www.forest.go.kr), resulting in the identification of 480 forest fire occurrence points of forest fire. Of these points, 70% were used to train the forest fire susceptibility mapping model, and the remaining 30% were employed for model validation. In addition, 480 comparison points were established in areas devoid of fire occurrence. Each points of forest fire occurrence was labeled as 1, and each non-occurrence point was labeled as 0.
Factors Influencing the Occurrence of Forest Fires
Natural disasters, including forest fires, result from the complex interplay of different factors. In this study, we identified multiple relevant factors and incorporated them into forest fire susceptibility mapping of the Gangwon-do region on the basis of prior research and the specific attributes of the study area. These factors were as follows: aspect, elevation, forest age, forest tree diameter, forest tree density, forest type, plan curvature, profile curvature, slope angle, soil depth, soil drainage, soil texture, soil topography, soil type, topographic position index (TPI), terrain ruggedness index (TRI), normalized difference vegetation index (NDVI), and distance to stream. Given that the original data were in various formats, including points, lines, and polygons, all information used in the forest fire analysis was standardized to a 30 m grid format. Data on forest characteristics and soil were sourced from the Korea National Spatial Data Infrastructure Portal (http://data.nsdi.go.kr/). We used values of NDVI for April to July for each year to most effectively differentiate forest cover from other types of land cover in the study area. This selective approach, coupled with a temporal aggregation method that involves combining or averaging NDVI values over the selected months (April to July) for each year, can mitigate the effects of transient environmental factors. Such factors include cloud cover, which can obscure the satellite imagery and affect the accuracy of NDVI measurements. By aggregating data over time, the impact of these factors is reduced, leading to a more reliable differentiation between forest and non-forest land cover.
Methodology
The Random Forest (RF) model, an ensemble learning method, constructs multiple decision trees to make predictions. This technique averages the outcomes (for regression tasks) or selects the most common outcome (for classification tasks) among the constructed trees, effectively reducing the overfitting issue prevalent in single decision trees. Its versatility allows application in both classification and regression scenarios, accommodating categorical and numerical data and managing large, high-dimensional datasets. Importantly, the RF model can identify key variables impacting the outcome, enhancing interpretability. Within the realm of geological engineering, the RF model integrates various factors to predict wildfire-prone areas. It adeptly handles complex interactions and non-linear relationships, making it particularly suitable for the intricate dynamics of wildfire susceptibility. Logistic Regression (LR), a fundamental statistical method, is employed for predicting binary outcomes by assessing the relationship between a dependent variable and one or more independent variables using a logistic function. This approach is favored for its simplicity and interpretability, especially in binary classification tasks within machine learning. In geological engineering contexts, LR aids in forecasting wildfire occurrences by quantifying how distinct factors influence fire likelihood. This capability is invaluable for assessing the impact of specific geological or environmental conditions on fire risk and for identifying susceptible regions. The Support Vector Machine (SVM) algorithm, used predominantly for classification though adaptable to regression, operates by plotting data points in an n-dimensional space (defined by the number of features) and finding the optimal separating hyperplane between classes. SVM is particularly effective in high-dimensional contexts and when the sample size is less than the number of dimensions, making it ideal for applications like text classification where distinct class boundaries are essential. In geological engineering, SVM’s ability to discern subtle distinctions in data structure enables precise classification of areas based on wildfire susceptibility, even within complex geological landscapes.
Assessment of Forest Fire Susceptibility
For the mapping of forest fire susceptibility in this study, three models (RF, LR, and SVM) were optimized using advanced algorithms to efficiently search for and identify optimal parameters. This optimization enhanced the accuracy and efficiency of forest fire susceptibility mapping for each model. A forest fire susceptibility map was generated for each model. The maps were classified into five levels (classes) of fire susceptibility—very low, low, medium, high, and very high—utilizing the geometric interval classification method. This statistical technique categorizes numerical data into groups based on value ranges and segments the data into intervals of equal geometric ratios rather than equal arithmetic differences, which is a more meaningful segmentation method for studying natural disaster susceptibility. These intervals are then used to generate thematic maps for data visualization. In the context of forest fire susceptibility mapping in this study, this method was employed to categorize the data into five distinct levels based on data values. The degree of similarity in the spatial distribution of forest fire susceptibility among maps was obtained by both visual inspection and frequency ratio analysis. Visual inspection involved a qualitative comparison of the spatial patterns and areas classified within various susceptibility categories across the maps. This intuitive approach provided an initial assessment of the congruence among the maps produced by different models. Frequency ratio analysis, on the other hand, is a more quantitative method. It was employed to systematically evaluate the consistency between observed fire events and the susceptibility categories defined by each model. This involved calculating the ratio of the area affected by fires within each susceptibility category to the total area of that category across the study region.
The final outcomes of the models used for forest fire susceptibility mapping in this study are presented in Table 1 and Figs. 2 and 3. Of the three models examined, the RF model exhibited the best performance, with an area-under-the-curve score of 0.936. The LR model predicts that 27.81% of the study area has very low susceptibility to forest fires, whereas 16.32%, 14.71%, 16.42%, and 24.67% of the study area has low, medium, high, and very high susceptibility, respectively. The SVM model predicts that 20.03%, 15.01%, 15.34%, 19.30%, and 30.32% of the study area has very low, low, medium, high, and very high forest fire susceptibility, respectively, and the RF model has corresponding values of 12.16%, 16.09%, 22.84%, 24.56%, and 24.35%, respectively (Table 1). Our results show that the inclusion of forest map data and soil map data for assessing forest fire susceptibility improves model performance in the prediction of susceptible areas, including with respect to previous methodologies that used classification and regression tree (CART: 0.751), random forest (RF: 0.835), and boosted regression tree (BRT: 0.846) algorithms, as documented by Piao et al. (2022).
Table 1.
Statistics on forest fire susceptibility classification for the LR, SVM, and RF models
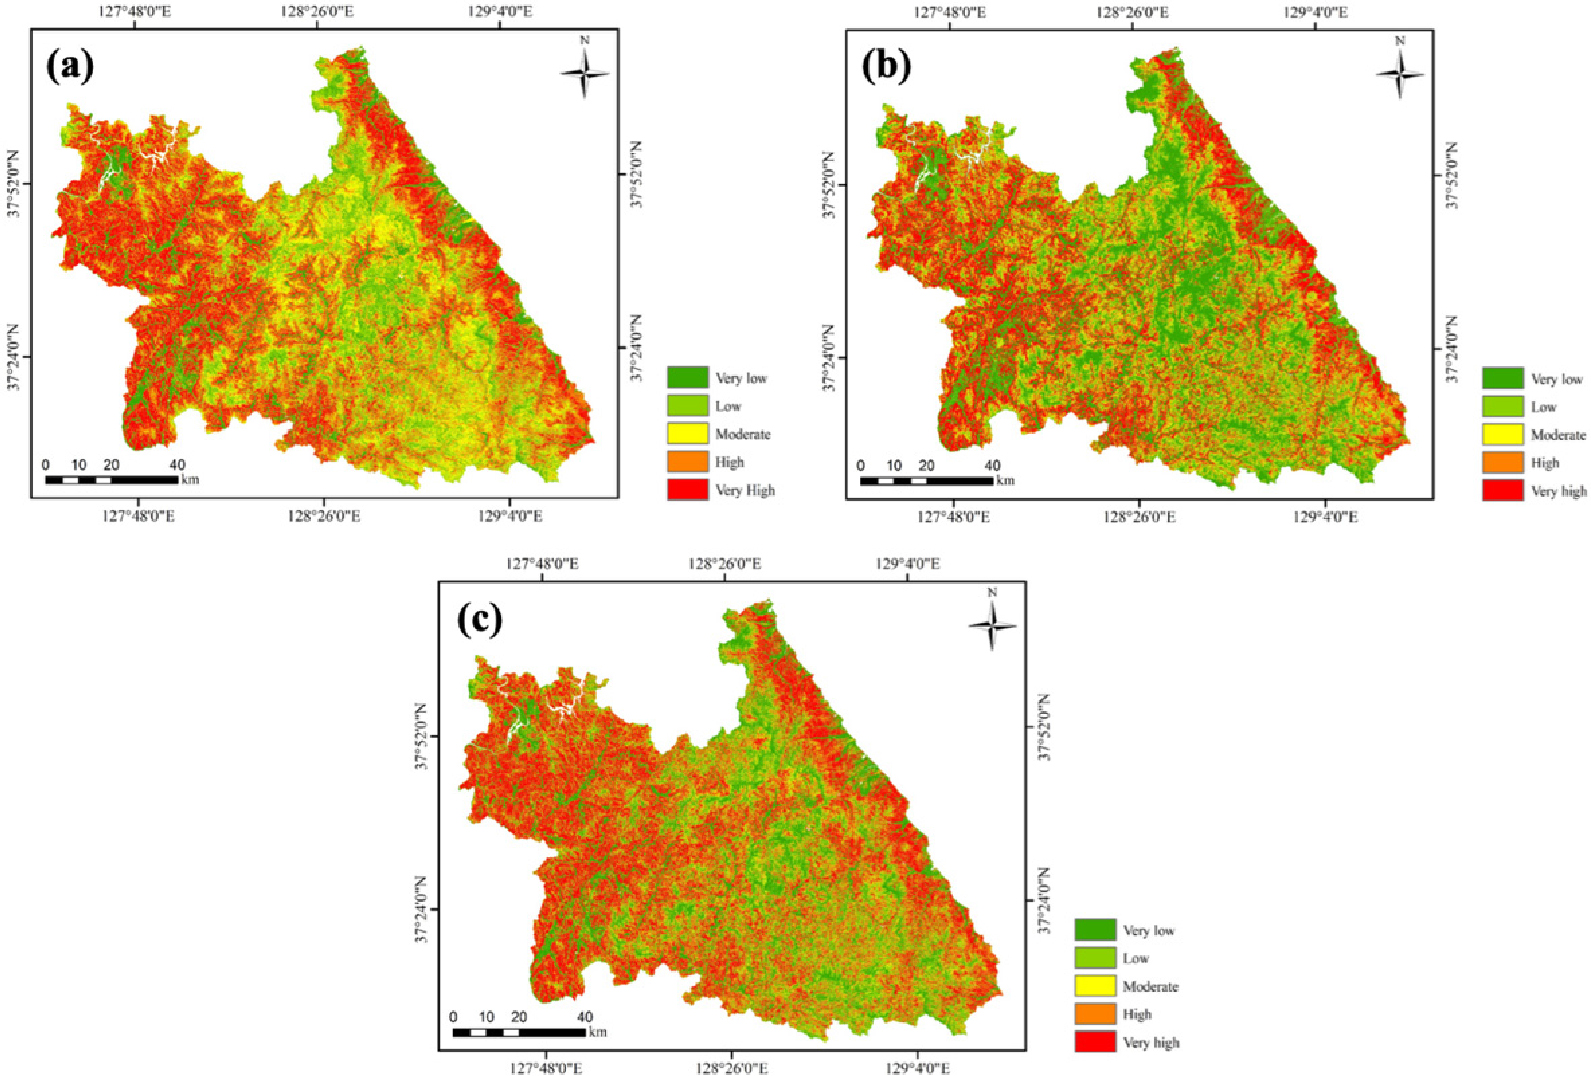
Fig. 2.
Forest fire susceptibility maps generated by the Random Forest (RF) model (a), Logistic Regression (LR) model (b), and Support Vector Machine (SVM) model (c). The geometric interval classification method divided the susceptibility into five classes, with each class being categorized into equal intervals.
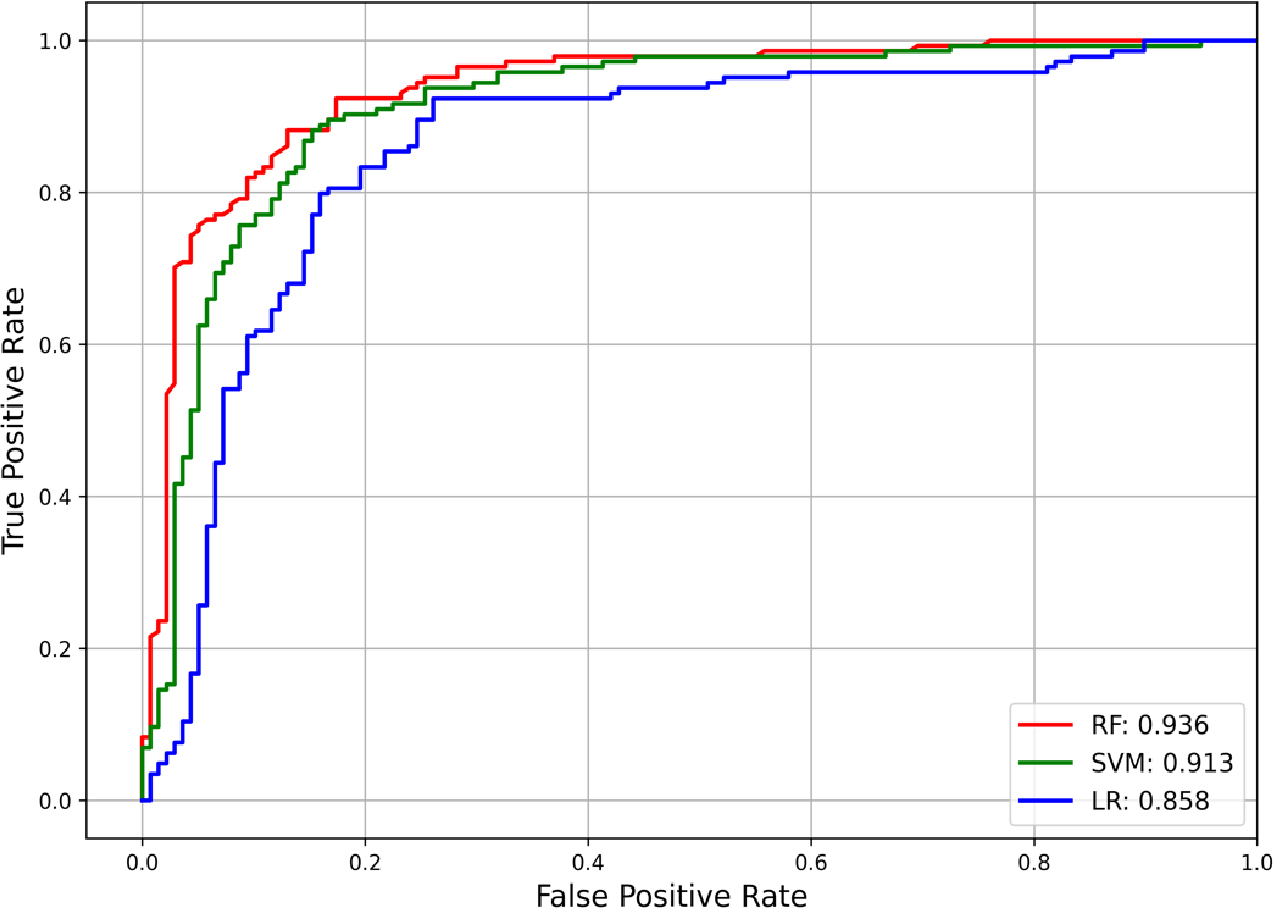
Fig. 3.
ROC (Receiver Operating Characteristic) plot for the assessment of predictive performance for forest fire susceptibility mapping using the RF, SVM, and LR models. ROC plot is a graphical representation that shows the diagnostic ability of binary classifiers, which is a fundamental assessment tool in machine learning for classification problems. It plots the True Positive Rate (TPR, also known as sensitivity or recall) against the False Positive Rate (FPR, 1 - specificity) at various threshold settings. The TPR is plotted on the y-axis, and the FPR is plotted on the x-axis.
Discussion
The superior performance of the Random Forest (RF) model in forest fire susceptibility assessment, as indicated by the highest area-under-the-curve (AUC) score of 0.936 compared to Logistic Regression (LR) and Support Vector Machine (SVM) models, can be attributed to several factors, particularly in the context of geological engineering. Firstly, the RF model’s robustness in handling various data types and its ability to manage complex, non-linear relationships between variables make it particularly suited for evaluating forest fire susceptibility. Unlike LR, which assumes a linear relationship between the dependent and independent variables, RF can capture the intricacies and interactions between multiple factors that influence forest fire risk, such as topography, vegetation, climate conditions, and human activities. This is crucial in geological settings where these factors can vary significantly and unpredictably. Secondly, the RF model’s ensemble approach reduces the risk of overfitting by averaging multiple decision trees’ predictions. This approach improves the model’s generalizability and accuracy in predicting forest fire susceptibility across different regions and conditions. On the other hand, SVM, while effective in high-dimensional spaces, might not capture the geographic and environmental heterogeneity as effectively as RF due to its reliance on defining hyperplanes for classification. The differing susceptibility percentages predicted by the models reflect their varying approaches to data analysis and classification. The RF model’s distribution suggests a more nuanced understanding of the study area’s fire susceptibility, which could lead to more targeted and effective fire management practices. In contrast, the LR and SVM models, while still useful, might offer a less detailed view, potentially leading to less optimal resource allocation and risk management strategies in the context of geological engineering and environmental planning.
Conclusion
Forest fires are a major natural hazard in South Korea, as they cause considerable damage to ecosystems and to human activity and property, causing large economic losses annually. Consequently, predicting and modeling forest fire occurrence is crucial. Forest fire susceptibility maps are particularly valuable, as they provide insights for planners and decision-makers in the development of forest fire prevention and management strategies. The inclusion of forest and soil map data in this study enhanced the predictive performance of fire susceptibility models compared with models that did not utilize these map data, allowing the most susceptible areas to be more accurately identified. As illustrated in Fig. 3, the RF model exhibited the best performance in terms of forest fire susceptibility mapping, evidenced by its highest AUC score among the models evaluated. The RF model’s more nuanced and accurate representation of susceptibility categories, particularly in areas with complex terrain and vegetation patterns. The results of this study are expected to assist local governments in developing effective strategies for fire management and forest conservation. These strategies are aimed at promoting the sustainable preservation of forest resources and improvement of the livelihoods of communities in areas adjacent to forests. In addition, the outcomes of this study are anticipated to contribute to the safeguarding of forest resources and biodiversity and to the development of comprehensive plans for forest resource protection, biodiversity conservation, and environmental management.
